🚀 Why Views Alone Don’t Define Success
Every creator has felt that rush of seeing view counts rise. But here’s the truth: a million views doesn’t guarantee impact, brand growth, or revenue. Too many marketers still chase “vanity metrics,” while ignoring deeper insights that shape strategy.
Platforms like YouTube and TikTok don’t just reward clicks—they reward attention and action. That’s why metrics such as watch time, audience retention, and engagement rate now determine whether your content gets promoted to wider audiences. NerdChips has already covered Video Marketing Trends shaping this space, but it’s time to drill down into the five data points that separate real performance from surface-level hype.
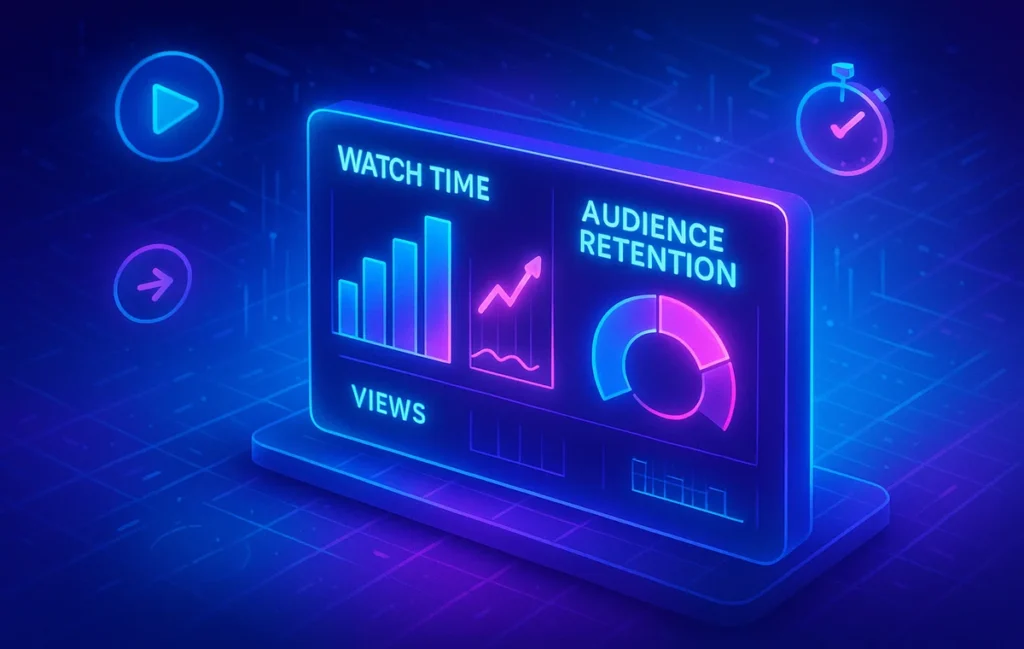
⏱️ Watch Time: The Currency of Attention
Watch time is the total minutes viewers spend watching your videos. YouTube, for example, explicitly states that longer watch time signals value to the algorithm. A creator with 10,000 views averaging 5 minutes per view outperforms another with 100,000 views averaging 30 seconds.
This metric reflects not only reach but also relevance. If your viewers stick around, your storytelling resonates. Research by Google shows videos that sustain high watch time are 2.6x more likely to land on the homepage or “suggested videos” section.
To increase watch time, build narratives that unfold, use curiosity gaps, and structure videos into chapters. It’s not about being long—it’s about being worth watching.
For a deeper understanding of how analytics shape these outcomes, dive into YouTube Analytics Explained.
📊 Audience Retention: The Engagement X-Ray
Retention shows where viewers drop off. It’s the heartbeat graph of your video. If most of your audience leaves in the first 20 seconds, your intro failed. If they drop mid-video, your pacing might drag.
Retention data lets you identify friction points. Successful creators often obsess over the “first 30 seconds,” testing hooks that keep viewers locked in. A 2024 Tubefilter analysis revealed videos with over 70% retention in the first minute were 4x more likely to be recommended by YouTube’s AI-driven feed.
By pairing retention with A/B experiments, as covered in A/B Testing Your Video Content, you can fine-tune delivery until your audience stays longer. Retention doesn’t just reveal problems—it maps your opportunity to refine.
🎯 CTR on Thumbnails: Winning the First Click
Click-Through Rate (CTR) measures how many people who saw your thumbnail/title actually clicked. This is your first impression metric. No click, no watch time—simple as that.
Industry benchmarks suggest YouTube videos average 2–10% CTR. Elite creators? They hit 12–15% consistently by optimizing visuals and copy. MrBeast himself has emphasized thumbnails as “the most important growth lever.”
CTR is where creativity meets psychology. Bold colors, expressive faces, clear text, and curiosity-driven headlines matter. But remember—clickbait that fails to deliver tanks retention and ultimately harms your channel.
If you want more than clicks—if you want momentum—CTR must be balanced with honest storytelling. That’s where tools from Video SEO Beyond YouTube help optimize discovery without gimmicks.
💬 Engagement Rate: Beyond Passive Watching
Engagement is how viewers interact—likes, comments, shares, and even rewatches. While algorithms don’t disclose every factor, engagement signals community energy.
A video with modest views but a 10% engagement rate often outranks one with high views and low interaction. Why? Because platforms see conversations and sharing as evidence of cultural relevance.
Engagement also builds brand authority. In the words of one X user: “Views show curiosity. Comments show connection.”
To boost engagement, ask questions in your videos, use pinned comments, and respond actively. This transforms viewers into collaborators. It’s also the foundation for building a funnel, like we explored in Building a Video Marketing Funnel.
💵 Conversion Rate: The Metric That Pays
At the end of the day, video marketing isn’t just about attention—it’s about action. Conversion rate measures how many viewers take the desired step: clicking a CTA, signing up for a newsletter, or buying a product.
Brands obsess over this because it ties video directly to ROI. A Wyzowl report in 2024 showed that 84% of consumers were convinced to buy after watching a brand video. Even a modest conversion rate of 2–3% can drive huge growth if your funnel is built correctly.
Tracking conversions requires setup—UTM links, landing pages, and analytics integration—but the payoff is clarity. When you know which video drives revenue, you stop chasing vanity and start scaling strategy. For more on structuring this path, revisit Video Marketing Funnel.
⚡ Ready to Level Up Your Video Strategy?
Track the right metrics and stop chasing vanity numbers. Explore tools that help you analyze watch time, retention, CTR, and conversions—all in one place.
📈 Benchmark Numbers: Knowing Where You Stand
It’s easy to read about metrics in theory, but without context they’re just numbers. That’s why industry benchmarks matter. They act as a compass for marketers to measure their progress against the broader landscape.
On YouTube, the average Click-Through Rate (CTR) sits between 4–5%, with high-performing videos often breaking into the 8–12% range. For audience retention, creators who sustain 50% of viewers past the midpoint of their video typically outperform their peers. When it comes to engagement rate, a healthy standard is 5–8%, though some niche communities can see double digits. And for conversion rate, brand videos often hover around 2–3%, while product demo or testimonial-style videos can climb to 5% or more.
Sharing these figures with clients or teams helps ground expectations. If your CTR is 3%, you’re not failing—you’re just slightly under industry norms, which points to thumbnails or titles as areas for optimization. Metrics without benchmarks can be demoralizing; with benchmarks, they become a roadmap to growth.
🧪 Case Study Snapshot: Lessons from the Field
Metrics become more powerful when paired with real-world examples. Consider the case of a mid-size educational YouTube channel with around 150,000 subscribers. For months, their CTR hovered at 3%, and growth was stagnant. By redesigning their thumbnails with bolder visuals and tweaking titles to highlight outcomes (“Learn Python in 30 Days” vs. “Python Basics”), they lifted CTR to 9% in two months. The result wasn’t just more clicks—watch time increased, and ad revenue doubled.
Another case: a SaaS brand used explainer videos embedded in landing pages. Initially, retention dropped sharply after 40 seconds. By restructuring the video into a story arc and adding on-screen text to reinforce CTAs, retention improved by 25%, and conversion rates jumped from 2.1% to 4.7%.
These stories illustrate a key lesson: metrics aren’t abstract—they are levers you can pull. Small improvements compound into dramatic results.
🎮 Platform Differences: Metrics that Matter Most
Not all platforms weigh metrics equally. On YouTube, watch time and audience retention dominate because the algorithm’s goal is to keep users on the platform. On TikTok, however, the algorithm focuses heavily on completion rate—if most viewers finish your 15-second video, it signals stickiness. Meanwhile, LinkedIn Video prioritizes engagement: comments and shares carry more weight than raw watch time because the platform optimizes for professional conversation.
For marketers, this means strategy should be platform-specific. A long-form 20-minute video optimized for YouTube might underperform on TikTok, while a short, snappy reel may thrive there but feel too shallow for LinkedIn’s audience. By aligning metric priorities with platform logic, you avoid wasting effort chasing the wrong signals.
🔄 Connecting Metrics Together: The Domino Effect
One mistake beginners make is treating metrics in isolation. In reality, they’re interconnected—like gears in a machine. For example, a high CTR thumbnail might generate clicks, but if the video fails to deliver on its promise, retention drops, watch time suffers, and the algorithm punishes your content. Similarly, strong watch time with weak CTAs means viewers leave impressed but don’t take action, stunting conversions.
Think of it as a metric funnel:
-
CTR brings the audience in.
-
Retention keeps them engaged.
-
Engagement transforms them into a community.
-
Conversions turn them into customers.
Each stage strengthens the next. Neglect one, and the system weakens. For sustainable growth, creators must optimize holistically, treating metrics not as separate KPIs but as a chain of cause and effect.
🔮 Future of Video Metrics: Beyond Today’s Dashboard
Looking ahead, the way we measure video success will evolve. Platforms are already experimenting with AI-driven satisfaction metrics. For instance, YouTube has hinted at surveys and implicit signals like rewatches, muted skipping, or even sentiment analysis from comments as future indicators. TikTok is rumored to be developing viewer sentiment scores that gauge emotional reactions beyond likes or shares.
We may soon see metrics like Brand Lift Index—AI-estimated impact on brand perception—or Predictive Conversion Probability, where algorithms calculate the likelihood of a viewer converting within days after watching a video. These metrics would shift focus from surface activity to deeper business impact.
For creators and marketers, this means one thing: adaptability is key. If you learn to interpret current metrics beyond views, you’ll be ready to embrace the smarter, AI-powered dashboards of tomorrow. NerdChips will continue tracking these developments, much like we’ve tracked Video SEO Beyond YouTube and broader Video Marketing Trends.
Want More Smart Video Marketing Insights?
Join the NerdChips newsletter and get weekly strategies on analytics, funnel building, and growth—delivered straight to your inbox.
100% privacy. No fluff. Just data-driven video marketing insights from NerdChips.
🧠 Nerd Verdict
At NerdChips, our verdict is simple: views are the entry ticket, not the scoreboard. True video marketing mastery means tracking watch time, retention, CTR, engagement, and conversions together. These metrics build a 360° picture of performance—where curiosity, attention, and action align. Chasing views may win you applause, but chasing impact wins you growth.
❓ FAQ: Nerds Ask, We Answer
💬 Would You Bite?
If you had to focus on just one metric for your next campaign—would you prioritize attention (watch time) or action (conversion)?