🧭 Intro
If you’re still guessing which channel actually drives revenue, you’re not alone. GA4 shipped with a fresh attribution engine, yet many marketers are still stuck in last-click thinking—or worse, mixing numbers from GA4, Google Ads, and spreadsheets that never agree. The result is misallocated budget and arguments that never end. This guide removes the fog. We’ll set up attribution models in Google Analytics 4 step by step, compare results across models, and show you how to use those insights to reallocate spend with confidence.
By the end, you will know how to choose the right attribution model for your sales cycle, configure lookback windows, compare model outputs, and build a routing workflow where paid, organic, email, social, referral, and even affiliates pull their weight transparently. Along the way, we’ll connect to deeper playbooks on Marketing Attribution Software, practical Google Ads Optimization Tips, and building Automatic Reporting Dashboards so your whole funnel becomes measurable—not mythical.
💡 Nerd Tip: Before you change models, define success. Decide which decisions you’ll change if the data points a different way (budget, bids, creative, placements). Data only matters if it moves money.
🧠 What Are Attribution Models (Quick Refresher)
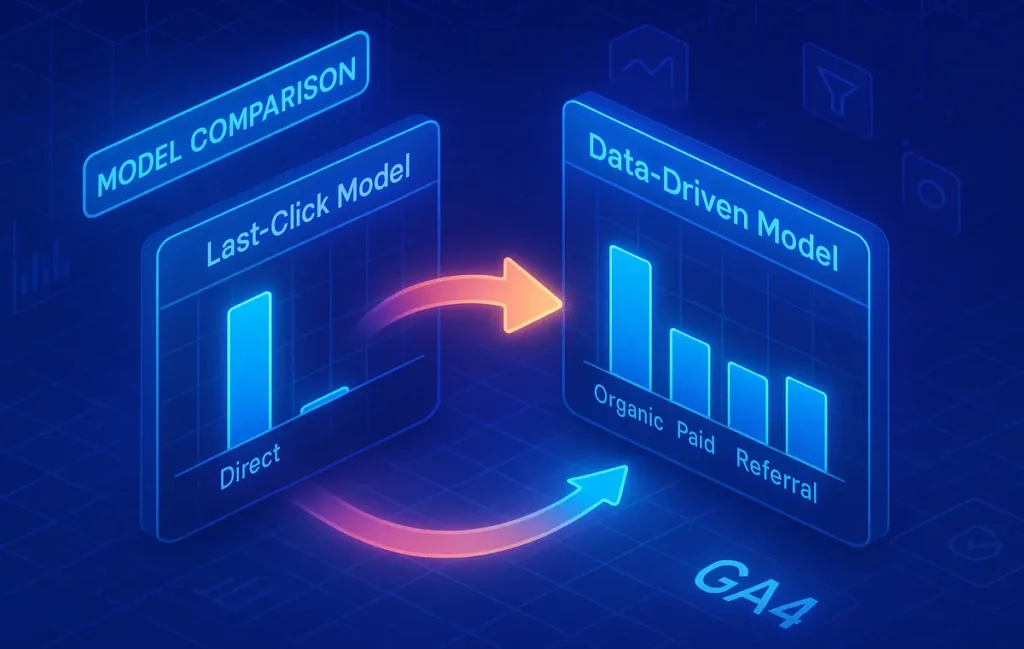
An attribution model is simply a rule for how to divide conversion credit across touchpoints. When a user discovers you on TikTok, researches on Google, clicks an affiliate review, and later converts via an email promo, who deserves the credit? In last-click models, the email would take 100%. In first-click, TikTok would take it all. In other models, credit is shared.
Why does this matter? Because the model determines where budgets flow. If you bias measurement toward the final click, you will chronically underfund discovery and consideration channels that prime demand. If you over-index first click, you may overpay for awareness that never closes. Good attribution is not perfection; it’s consistent, decision-ready data that reduces guesswork. The goal is to be directionally right enough to shift resources—while you test and validate changes in performance.
💡 Nerd Tip: Treat attribution as a hypothesis engine. Use models to form a POV on which channels assist versus close, then test budget changes and confirm with lift in blended CAC/ROAS.
🧭 GA4 Attribution Models Explained (and When to Use Each)
GA4 supports several familiar models, plus a Data-Driven option that uses machine learning on your property’s data. Each has tradeoffs. Think of them as lenses; no single lens tells the full story.
Last Click gives 100% of credit to the final non-direct touchpoint before conversion. It’s simple and often conservative: great for short cycles and direct-response promos, but it suppresses the apparent value of channels that generate consideration. If you judge upper-funnel with last click, you’ll likely underfund it.
First Click grants full credit to the first touch. This is useful for understanding acquisition engines—what brings people into your world—but risky if you neglect closers. Consider it a diagnostic view rather than a budgeting default.
Linear shares credit evenly across all touchpoints. In long B2B cycles or multi-week consumer journeys, linear can be a fair baseline. The downside is it treats crucial steps and minor assists equally.
Time Decay increases credit for touches closer to conversion. If your final-mile marketing (remarketing, branded search, cart abandon) reliably closes deals, time decay acknowledges that behavior without erasing earlier assists.
Position-Based (U-Shaped) gives the first and last interactions heavier weights (commonly 40% each) and splits the remainder among the middle. This is a strong pattern whenever discovery and closing are the most valuable steps.
Data-Driven assigns fractional credit based on how different touchpoints historically contribute to conversion on your property. When you have sufficient traffic and clean event configuration, this is typically the best “always-on” model because it learns from your mix and can change over time. Caveat: if your data volume is low or journeys are extremely short, DDA may feel jumpy or default back to simpler heuristics.
Mini Model Matrix
| Model | Best for | Watchouts |
|---|---|---|
| Last Click | Short cycles, DR offers, end-of-funnel tests | Under-credits awareness/assists |
| First Click | Top-of-funnel diagnostics | Over-credits discovery, ignores closers |
| Linear | Long, collaborative journeys | Weights minor assists too much |
| Time Decay | Strong closer strategy w/ assists | Picks winners near the end |
| Position-Based | Discovery + closer heavy mix | Middle interactions underrated |
| Data-Driven | Mature properties with volume | Needs clean data; low volume = noisy |
💡 Nerd Tip: Don’t marry a model. Use Model Comparison in GA4 weekly to spot where credit shifts. Stable gaps suggest true contribution differences; wild swings signal data problems.
🛠 Step-by-Step Setup in GA4
This is the canonical flow for getting attribution right in GA4. Stay methodical and you’ll prevent most downstream mismatches.
1) Confirm Conversions & Channel Hygiene
Start in Admin → Data display → Events and mark your true business outcomes as Conversions (e.g., purchase, lead_submit, demo_booked). Create key events for micro-conversions if they’re critical (trial_start, pricing_view), but avoid flooding GA4 with noisy events. In your site tags and campaigns, standardize UTM parameters so GA4’s Default Channel Grouping classifies traffic accurately—this alone fixes many “direct/none” mysteries. If affiliates are core, build a custom channel group to break them out cleanly and reference our guide to Best Tools for Tracking Affiliate Marketing Performance for link hygiene.
2) Enable Google Signals (Cross-Device)
Go to Admin → Data collection → Google signals and enable it. Signals improves cross-device stitching and powers more complete attribution paths (subject to consent). If you advertise on Google, this also improves conversion modeling in privacy-constrained environments.
3) Choose the Default Attribution Model & Lookback Window
Navigate to Admin → Attribution settings. Set your Reporting attribution model. For most teams, Data-Driven is the default, with Last Click as a comparison lens for sanity checks and stakeholder expectations. Next set your Lookback Window: 30 days fits fast B2C cycles; 60–90 days suits B2B or higher-consideration purchases. Use a shorter lookback on “acquisition” events if you need clarity on what truly introduces users, and a longer window for bottom-funnel conversions.
💡 Nerd Tip: Keep a change log. Any switch in model or lookback window should be documented with date/time and sent to the team. Otherwise, month-over-month reports will look “broken.”
4) Link Google Ads & Import Conversions Thoughtfully
Under Admin → Product links, connect Google Ads and ensure that the conversions you care about are synched and counted once. Remember: GA4 reporting attribution does not change Ads billing; Ads uses its own attribution settings. Align your windows and conversion definitions to reduce head-scratching. Our Google Ads Optimization Tips goes deep on how to bid to GA4 conversions without double-counting.
5) Compare Models in the Advertising Workspace
Open Advertising → Model comparison. Choose a conversion (e.g., purchase) and compare Data-Driven versus Last Click (and other models) for a realistic date range (e.g., last 30 days). Watch how credit shifts between Paid Social, Organic Search, Email, Affiliate, and Direct. Now open Conversion paths to see common path lengths and the roles channels play (early, mid, late). This is where you form hypotheses: “Paid Social is assisting 40% of paths that close on Brand Search—cutting it hurt us last quarter.”
6) Build Decisionable Dashboards
Attribution isn’t just an internal GA4 view. Push decision-ready visuals to Looker Studio or your BI layer and standardize weekly reviews. Start with a one-page scorecard: spend, revenue, ROAS, assisted conversions, top paths, and model deltas (how credit changes by model). Then automate delivery to stakeholders. Our guide on Set Up Automatic Reporting Dashboards includes a template so you don’t reinvent the wheel.
💡 Nerd Tip: Separate reporting from billing. It’s okay for GA4 to run DDA while Ads uses last-click or data-driven within Ads. Just label reports clearly so finance and channel owners understand what they’re looking at.
⚡ Stop Guessing. Start Funding What Works.
Set up GA4 attribution the right way, compare models, and automate dashboards that drive budget decisions—not debates.
📈 Real-World Examples (What Changes When You Change the Lens)
Example A — Paid Social that “Never Converts” (Until It Does)
A DTC brand sees Paid Social “underperform” in last-click GA4 reports. Model comparison shows Data-Driven shifts ~18% of purchase credit from Brand Search and Email to Paid Social assists. Paths reveal a common pattern: Paid Social → Organic Search → Brand Search → Purchase within 10 days. Action: maintain or raise top-funnel budgets while tightening audience and creative, and judge success using DDA with a 30-day lookback. Result: blended CAC stabilizes even as last-click ROAS for social stays modest.
Example B — Email Reactivation vs. Prospecting
A SaaS org debates whether reactivation emails “steal credit” from performance channels. Time-decay shows Email takes more end-weight, but Data-Driven credits Display Retargeting for reviving dormant users that later respond to Email. Action: keep retargeting live, but reduce frequency caps to avoid fatigue. In model comparison, the split stabilizes and unsubscribes drop.
Example C — Affiliates vs. Influencers
Using a custom channel group to split “Affiliate” from “Influencer,” a publisher finds that Influencer posts dominate first-click, while Affiliates dominate last-click. Position-based reveals a healthy 40-40 split for first and last touches with a thin middle. Action: pay influencers on assisted + first-click contribution while negotiating last-click commissions with affiliates. See Marketing Attribution Software if you need multi-touch payment logic beyond GA4 reporting.
💡 Nerd Tip: Expect upper-funnel channels to gain 8–20% more credit when you shift from last-click to DDA in multi-touch funnels. The exact number varies—use it as a hypothesis, not a promise.
🧯 Challenges & Fixes
Low Data Volume
Data-Driven models need volume and clean events. If you’re early-stage or in a niche, start with Position-Based or Time Decay and graduate to DDA as your dataset grows. Keep the lookback window aligned to real buying cycles—shorter for impulse, longer for considered purchases.
Cross-Device & Identity Gaps
Users research on mobile and buy on desktop. Turn on Google Signals and encourage account creation before purchase (loyalty, save cart). For privacy-constrained regions, ensure consent banners are implemented correctly; otherwise, paths will fragment and last-click will dominate by default.
GA4 vs. Google Ads Mismatch
Ads may show higher conversions due to different windows, view-through logic, or attribution settings. Document your settings and keep a one-pager that explains “why GA4 and Ads won’t match.” Align windows where possible, and rely on a single source of truth for budgeting (e.g., GA4 DDA for channel mix; Ads for in-platform bidding decisions).
Channel Misclassification (“dark direct”)
A big chunk of “direct/none” often signals broken UTMs, redirects stripping parameters, or links from apps/email clients without tagging. Audit your UTMs, use campaign URL builders, and verify that your landing pages preserve parameters post-redirect. Where affiliates are involved, standardize utm_source=affiliate, utm_medium=partner, and a named utm_campaign for each partner. Our primer on Best Tools for Tracking Affiliate Marketing Performance covers fail-safes.
Stakeholder Trust
Attribution changes can feel like moving goalposts. Build trust with a parallel-run: keep last-click views visible while introducing DDA, show clear deltas, and agree in advance how budget decisions will be made if the data disagrees with instincts.
💡 Nerd Tip: Create a Data Dictionary for channels and conversions. If the SDR team calls “qualified lead” something different than marketing’s “MQL,” attribution will reflect politics, not performance.
🧪 Implementation Playbook: A 30-Day Plan
Week 1 — Clean & Configure
Mark conversions correctly, sanitize UTMs, enable Google Signals, and link Google Ads. Set Data-Driven as your default model with a 30-day lookback (B2C) or 60-day (B2B). Start a change log.
Week 2 — Compare & Hypothesize
Use Model Comparison and Conversion Paths to identify 2–3 predictable shifts (e.g., Paid Social gains assist credit, Email loses a bit). Draft budget hypotheses: “Shift 10% spend to top-funnel creative that seeds branded search within 7–10 days.”
Week 3 — Pilot & Monitor
Make small, controlled budget moves. Update Looker Studio with a blended scorecard (spend, revenue, ROAS, assisted conversions, model deltas). Build one Data-Driven Content idea using attribution learnings (e.g., “channels that start vs. close the journey”) and publish it to attract the right buyers.
Week 4 — Decide & Document
If the pilot improved blended CAC/ROAS or pipeline velocity, codify the change. If not, revert and test a different lever (creative mix, frequency, landing page). The win is not picking the “perfect” model; it’s reducing uncertainty with disciplined iteration.
💡 Nerd Tip: Add a “Model Delta” tile to your dashboard: the difference in conversions/revenue between DDA and last-click by channel. When the delta is stable for 2–3 weeks, raise or lower budgets—confidently.
🧰 Pro Tips That Compound Over Time
-
Custom Channel Groups: Create one for Affiliates, another for Influencers, and split Paid Social by prospecting vs. retargeting with consistent UTMs. What isn’t segmented can’t be funded precisely.
-
Micro-Conversions with Meaning: Track trial_start, add_to_cart, demo_request. DDA needs good signals to learn which touches matter.
-
Path Length Awareness: If most conversions in your vertical close within 5 touches, use that to pressure-test whether you’re overspending on low-assist channels.
-
Budget Guardrails: When adopting DDA, set minimum budgets for discovery channels for 30–45 days. Don’t knee-jerk cut them if last-click dips.
-
Revenue Closed-Loop: If possible, tie GA4 conversions to CRM revenue for a true ROAS picture. Our walkthrough on Marketing Attribution Software explains how tools outside GA4 help here.
(Keep bullets minimal; the real work is in the paragraphs above—this list is your quick audit.)
📬 Want Attribution Wins in Your Inbox?
Join our free newsletter for GA4 playbooks, model comparison tactics, and no-nonsense reporting frameworks—delivered weekly by NerdChips.
🔐 100% privacy. No noise. Only field-tested analytics insights.
🧠 Nerd Verdict
Attribution in GA4 isn’t a magic truth machine—it’s a set of lenses that help you make better calls. The “right” model is the one that, when applied, improves blended CAC/ROAS and pipeline velocity because you moved money to the channels that actually create demand. For most teams with adequate data, Data-Driven as the default plus Last-Click and Position-Based for comparison will produce the clearest strategy. Set it up once, review it weekly, and let the numbers, not loud opinions, guide your spend. From the NerdChips POV, attribution is where creative, media, and analytics finally shake hands.
❓ FAQ: Nerds Ask, We Answer
💬 Would You Bite?
If you had to pick a budgeting lens today, would you run Data-Driven for decision-making and Last-Click for comparison—or stick to a single model across all reports to keep stakeholders aligned?
Crafted by NerdChips for creators and teams who want their best ideas to travel the world.