🎯 Intro: Why Journey Maps Without Data Are Just Assumptions
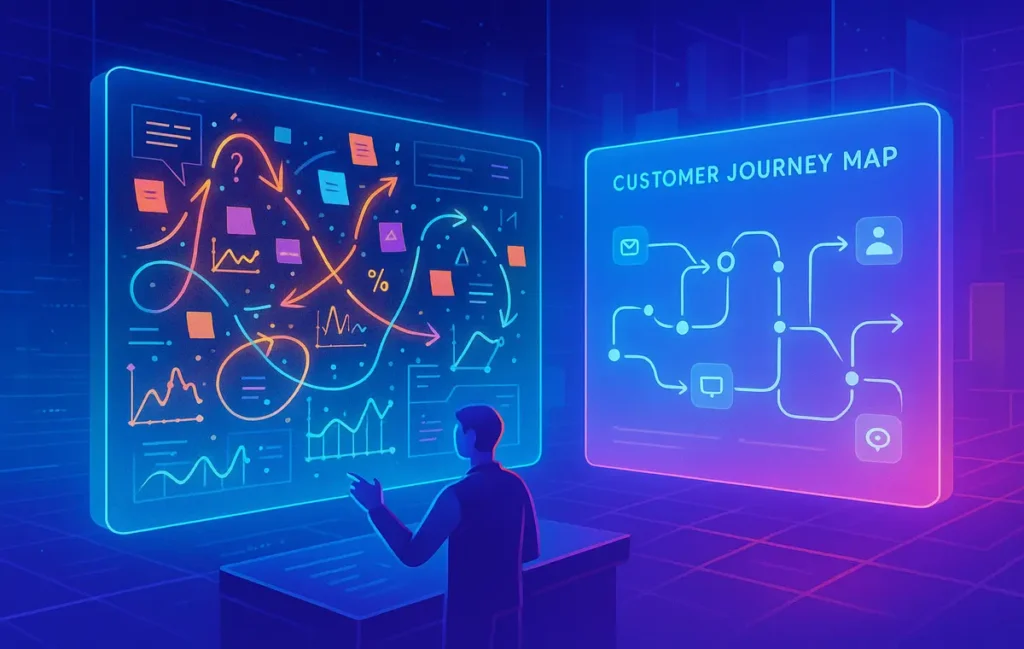
Marketers love diagrams. They love flowcharts with arrows moving from “awareness” to “purchase.” But here’s the uncomfortable truth: most customer journey maps are just guesswork. They’re crafted in meeting rooms with sticky notes, not in the real trenches of customer behavior. Without real data, a journey map is nothing more than a hypothesis. You think customers discover you on social, then read your blog, then convert. But maybe they actually stumble upon your pricing page first and only later go back to read reviews.
The difference between assumption and reality isn’t trivial. It’s the line between campaigns that burn cash and strategies that actually convert. At NerdChips, we’ve seen too many teams waste months optimizing the wrong touchpoints simply because they never looked at what the data was telling them.
💡 Nerd Tip: If your customer journey map looks neat and linear, you’re probably missing reality—because real customer paths are messy.
🤔 What Is a Customer Journey Map?
A customer journey map is a visual framework that represents the steps customers take from their very first interaction with your brand all the way through retention—or churn. It’s not just about the path to purchase; it’s about the emotions, motivations, and obstacles at each step.
The four key stages are well-known:
-
Awareness: The moment a potential customer realizes you exist.
-
Consideration: When they begin to evaluate your solution against alternatives.
-
Conversion: The point of decision—sign-up, purchase, or subscription.
-
Retention: The long game—building loyalty so they keep coming back.
But while these stages provide a structure, every business fills them differently. A SaaS platform’s journey will not mirror that of an e-commerce store. The critical part is ensuring that these maps reflect actual data from your customers—not wishful storytelling.
When done correctly, journey maps help align teams, prioritize resources, and remove friction from the customer experience. When done poorly, they are pretty infographics with zero impact.
📊 Why Real Data Matters in Journey Mapping
Here’s a hard truth: your customers’ behavior is rarely what you assume.
You might believe people discover your app through ads, but analytics shows that 60% actually come via organic search. You might assume the FAQ page is an afterthought, but heatmaps reveal it’s the second most-visited page before checkout.
Real data cuts through bias. It tells you where customers linger, where they drop off, and where they come back. For example, tracking click-through rates (CTR) across email campaigns may reveal that customers respond far more to feature updates than discounts. Monitoring time on page might highlight content bottlenecks where customers lose interest. Watching churn rates exposes weak points in retention strategies.
One SaaS founder shared on X that once they began analyzing behavioral data, they realized that 40% of sign-ups abandoned the onboarding process at a single confusing step. Fixing that boosted conversions by 22%. No brainstorm session could have uncovered that insight—it came directly from the data.
And that’s why real data is the lifeblood of effective journey maps. Without it, you’re just drawing pretty guesses.
💡 Nerd Tip: Track both behavioral data (clicks, sessions, funnel progress) and transactional data (purchases, upgrades, cancellations). The magic happens when you connect them.
🛠️ Step-by-Step: Building a Journey Map With Data
Step 1: Collect Behavioral & Transactional Data
The journey starts with listening to what customers actually do. Use affordable analytics tools to capture web sessions, sign-up rates, support tickets, and purchase patterns. Even Google Analytics or tools like Hotjar can expose surprising behaviors. Pair this with transactional records from your CRM or payment system. Data-driven content can only be created once you have a solid foundation of customer actions to interpret.
Step 2: Identify Touchpoints Across Channels
Every customer interacts with your brand in multiple ways: your website, email campaigns, paid ads, social channels, and support interactions. Mapping without including these touchpoints is like drawing a road map with missing highways. Studies show that over 70% of consumers use three or more touchpoints before making a purchase decision. By tracking where they land and what they click, you build a picture of the true journey.
Step 3: Segment Customers Based on Journeys
Not all customers follow the same path. Some convert on their first visit; others research for weeks. Segmentation allows you to see these differences clearly. For example, small businesses might first download a free resource, while enterprise buyers go straight to the demo request. This step requires grouping customers into cohorts, revealing distinct patterns.
💡 Nerd Tip: Don’t overcomplicate segmentation. Start with 2–3 core groups and refine over time as more data flows in.
Step 4: Visualize the Journey Map
Once you have segments and data, visualize them. Tools like Miro, Lucidchart, or UXPressia make it possible to create interactive maps that aren’t just static posters. Visualization forces clarity: where does the awareness stage begin, which touchpoints drive consideration, and where are the leakages?
Step 5: Spot Friction Points and Drop-Offs
Journey maps aren’t just for storytelling—they’re for diagnosis. Look at the data to find where customers exit. Is it during checkout? Is it after pricing? These are your friction points. In one e-commerce case, reducing checkout fields from 12 to 6 improved conversions by 30%. The journey map exposed the bottleneck.
Step 6: Optimize and Test
Journey mapping is not a one-time exercise. Once you spot problems, run A/B tests, tweak messaging, or refine UX. For example, if your map shows high drop-offs after email campaigns, run A/B tests with different subject lines. A beginner’s guide to A/B testing can help you validate changes without guesswork.
This cyclical approach—map, test, refine—turns the journey map into a living tool rather than a static asset.
🧰 Best Tools for Customer Journey Mapping
Several tools make it easier to build and refine journey maps with data at the core.
-
UXPressia: Built for customer experience teams, offering templates and persona integration.
-
Smaply: Great for collaborative journey mapping with stakeholder input.
-
Miro: A flexible whiteboard tool perfect for brainstorming and early visualization.
-
HubSpot: Provides CRM integration, connecting customer data directly to journey stages.
Each of these tools lowers the barrier for businesses, even small ones, to create professional-grade journey maps. Paired with affordable analytics tools for small businesses, they become powerful allies in designing customer-first strategies.
💡 Nerd Tip: Pick a tool that integrates directly with your analytics stack. Manual data entry kills momentum.
📈 Case Study: Boosting Conversions With Journey Mapping
Consider a mid-sized SaaS startup struggling with stagnant conversion rates despite solid traffic. The team assumed customers were dropping off at the pricing page. But when they built a journey map using session recordings and CRM data, they discovered something different: the real drop-off was during onboarding, specifically when users had to integrate their account with a third-party service.
Armed with this insight, they restructured onboarding, added clearer instructions, and offered live chat support. The result? A 28% increase in completed sign-ups within three months.
This mirrors what NerdChips often highlights: real growth comes from solving the exact friction customers experience, not the ones you imagine.
⚠️ Common Pitfalls to Avoid
Many companies make the mistake of building journey maps in isolation from data. The most common pitfalls include:
-
Building on assumptions instead of evidence. Maps created solely from brainstorming rarely reflect reality.
-
Collecting too much data without analysis. More dashboards don’t equal more clarity. Focus on metrics that matter: CTR, time on page, churn.
-
Ignoring customer feedback. Behavioral data is powerful, but pairing it with surveys or NPS feedback uncovers motivations behind actions.
💡 Nerd Tip: Combine quantitative data (analytics) with qualitative insights (customer interviews). That’s how you capture both the “what” and the “why.”
⚡ Ready to Build Smarter Journeys?
Try customer journey mapping tools like UXPressia or Smaply and turn data into real growth. Visualize paths, fix drop-offs, and scale conversions.
📊 Benchmark Data & Industry Stats: Proof That Data Works
It’s easy to claim that customer journey maps drive results—but the numbers tell the real story. According to a Gartner report, over 81% of companies say they’ve created customer journey maps, yet fewer than 8% actually update those maps with real customer data on a continuous basis. This means that most journey maps floating around are outdated, assumption-driven artifacts.
Contrast that with organizations that integrate live analytics and behavioral data into their journey maps: Forrester research shows these companies enjoy up to 20% higher customer retention rates and a 15% lift in conversion rates compared to their competitors.
Another data point comes from McKinsey: brands that act on customer journey insights rather than isolated touchpoint metrics see customer satisfaction scores improve by 30–40%. The message is clear—journey maps aren’t about looking good in a slide deck; they are about creating measurable impact on real metrics like churn, retention, and lifetime value.
💡 Nerd Tip: Treat your journey map as a KPI dashboard in disguise—it should tie directly to metrics you already care about, like CLV, conversion rates, or churn.
🌐 Advanced Layer: Omnichannel Mapping
One of the biggest weaknesses of many journey maps is that they focus only on the digital world—website clicks, ad impressions, email open rates. While these are crucial, they represent only part of the customer’s reality. In most industries, the journey doesn’t stop at the browser. It moves into offline experiences: a phone call with support, a conversation with a sales rep, or even an in-store experience if you operate hybrid retail.
Omnichannel mapping means zooming out to capture the entire customer reality. For example, a bank might discover that although their mobile app funnels customers well into loan applications, the actual drop-off happens when applicants get a follow-up call from the branch office that confuses them. Similarly, a SaaS company might find that while the website journey looks smooth, customer frustration spikes during onboarding webinars.
Ignoring these non-digital layers gives you a distorted view. When you add them, patterns emerge that were previously invisible. Omnichannel mapping not only enhances accuracy but also builds empathy: you see customers not as clicks and conversions but as humans moving across touchpoints that all matter.
💡 Nerd Tip: Add at least one offline or human touchpoint to every stage of your journey map—you’ll be surprised how much it changes the narrative.
📝 Linking Journey Data to Actionable Content
A customer journey map is only as valuable as the actions it inspires. Data-backed mapping exposes where customers drop off, but the real power lies in connecting those insights to content strategies.
For instance, suppose your journey map reveals that potential buyers abandon the funnel at the awareness stage because they don’t fully understand your product category. That’s not just a UX problem—it’s a content gap. By investing in data-driven content that educates them at this stage, you move them forward. Similarly, if churn happens post-purchase, creating personalized onboarding guides or interactive FAQs could directly patch that hole.
This is where journey maps intersect with growth content. A clear example is linking to affordable analytics tools for small businesses. By identifying drop-offs with these tools, you immediately know which type of content can reduce friction. For another case, journey maps often expose weaknesses in landing pages—perfect moments to apply CRO tips for product pages that increase clarity and trust.
In other words: your journey map is a content roadmap. Once you know where customers hesitate, you can design the exact content asset that removes doubt and keeps them moving.
💡 Nerd Tip: Don’t treat your journey map as a static diagram—treat it as a to-do list for your content and marketing teams.
❤️ The Emotional Layer in Data
Data tells you what customers do, but not always why they do it. That’s where the emotional layer comes in. If your analytics show customers abandoning at the pricing page, you know behaviorally where the drop-off happens. But why? Are they confused? Overwhelmed? Distrustful?
Combining quantitative data with qualitative insights gives the full picture. Customer surveys, live chat transcripts, reviews, and support tickets often reveal the feelings behind behaviors. Maybe customers feel sticker shock because value isn’t clear, or maybe they’re anxious about hidden fees.
Take Netflix, for example: their analytics showed churn spikes after the free trial. But qualitative feedback revealed the emotion—users felt “trapped” by the sudden payment requirement. Addressing that perception led Netflix to refine messaging and offer smoother transitions, reducing churn significantly.
When you merge analytics with customer voices, your journey map stops being a sterile data visualization and becomes an empathy-driven tool. It captures not just the steps, but the sentiments, motivations, and doubts along the way.
💡 Nerd Tip: For every behavioral drop-off you identify, pair it with at least one piece of qualitative feedback. Numbers tell you the “what,” but words tell you the “why.”
🚨 Case Study 2: The Cost of Failure
It’s not all success stories. Journey mapping done wrong can waste enormous resources. Consider an online retailer that assumed its low conversion rates were caused by pricing. Their marketing team slashed prices, ran discounts, and even bundled products—yet conversions barely budged.
Only after finally analyzing behavioral data did they uncover the truth: customers were abandoning at checkout because the form demanded too much unnecessary information, from birth dates to secondary phone numbers. The journey map they had relied on was based on internal assumptions, not actual data.
The fallout? Six months of lost revenue, wasted ad spend, and a price perception problem that hurt margins. Had they built their journey map with behavioral analytics and A/B testing for beginners, they would have spotted the checkout friction immediately.
This failure story is a reminder that guesswork is expensive. Every assumption you embed into a journey map without data is a gamble with your marketing budget.
💡 Nerd Tip: Audit your journey map once with the question: “What in this diagram is an assumption?” Then replace every assumption with evidence.
✅ Mini-Framework: The Data-Backed Journey Checklist
Here’s a simple framework you can run through to ensure your journey map is grounded in reality:
-
Collect: Gather both behavioral (analytics, funnels, heatmaps) and transactional data (sales, cancellations).
-
Segment: Divide customers into meaningful groups—fast converters, slow researchers, churn risks.
-
Visualize: Use tools like Miro or UXPressia to create clear, shareable maps.
-
Validate: Pair drop-off points with qualitative feedback to reveal emotions and motivations.
-
Optimize: Apply learnings to content, UX, and product design. Test changes through A/B experiments.
-
Update: Refresh your map quarterly or after major shifts to avoid stale assumptions.
Think of this checklist as a six-step loop. You’re never “done” with journey mapping—it’s a living asset that evolves as your customers evolve.
💡 Nerd Tip: Pin this checklist next to your whiteboard or dashboard—it’s the fastest way to keep your team grounded in data.
Want More Smart AI Tips Like This?
Join our free newsletter and get weekly insights on AI tools, no-code apps, and future tech—delivered straight to your inbox. No fluff. Just high-quality content for creators, founders, and future builders.
100% privacy. No noise. Just value-packed content tips from NerdChips.
🧠 Nerd Verdict
Customer journey maps powered by real data aren’t just another marketing diagram—they’re one of the most practical tools for discovering how customers actually behave. By grounding your map in analytics, touchpoints, and feedback, you move beyond assumptions into clarity. For marketers, founders, and product teams, this clarity often translates directly into revenue.
At NerdChips, our view is simple: the most profitable customer journeys are the ones you’ve validated with data, not the ones you’ve imagined.
❓ FAQ: Nerds Ask, We Answer
💬 Would You Bite?
If a data-backed journey map could show you exactly where customers drop off, would you build one for your business—or keep guessing?
Crafted by NerdChips for creators and teams who want their best ideas to travel the world.


